
Zoho Analytics Reviews & Product Details
Zoho Analytics is a business intelligence tool that allows users to transform raw data into meaningful insights and visually appealing reports. It stands out from the competition with its intuitive interface, flexible data modeling capabilities, and seamless integration with other Zoho apps. With features like data blending, advanced calculations, and customizable dashboards, Zoho Analytics makes data analysis accessible and actionable for businesses of all sizes.


| Capabilities |
|
|---|---|
| Segment |
|
| Deployment | Cloud / SaaS / Web-Based, Desktop Windows, Mobile Android, Mobile iPad, Mobile iPhone, On-Premise Linux |
| Training | Documentation |
| Languages | English |
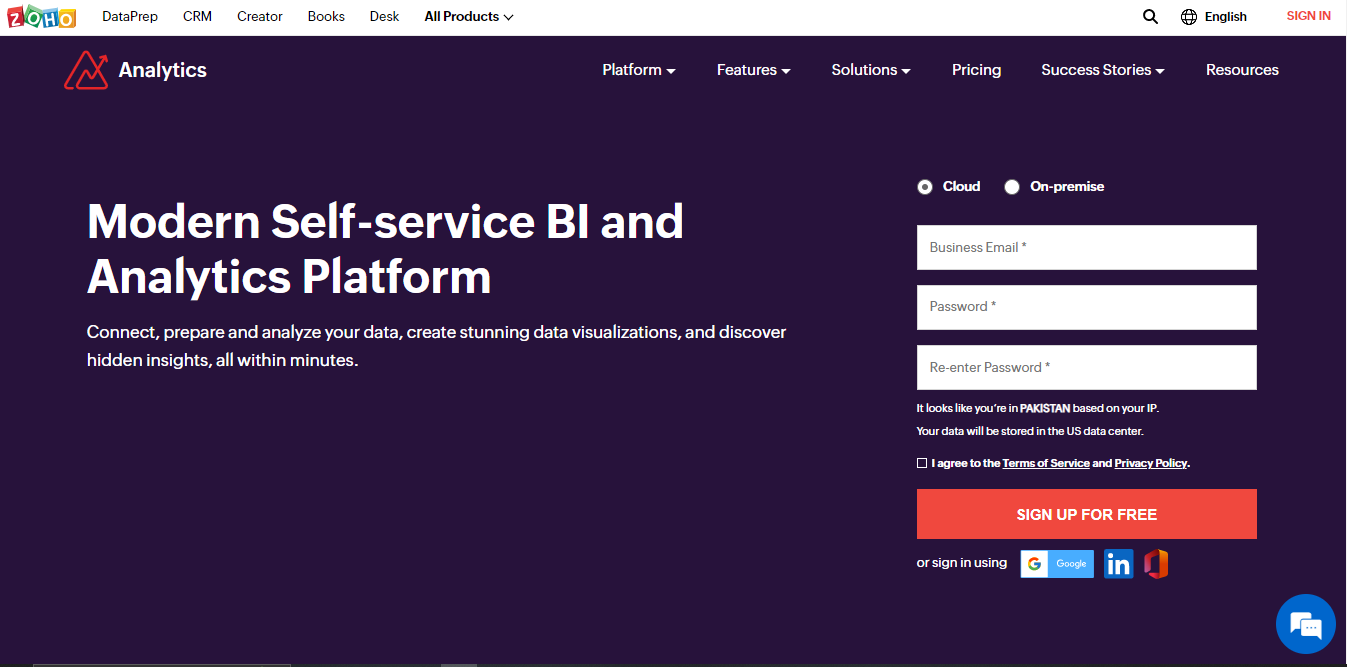
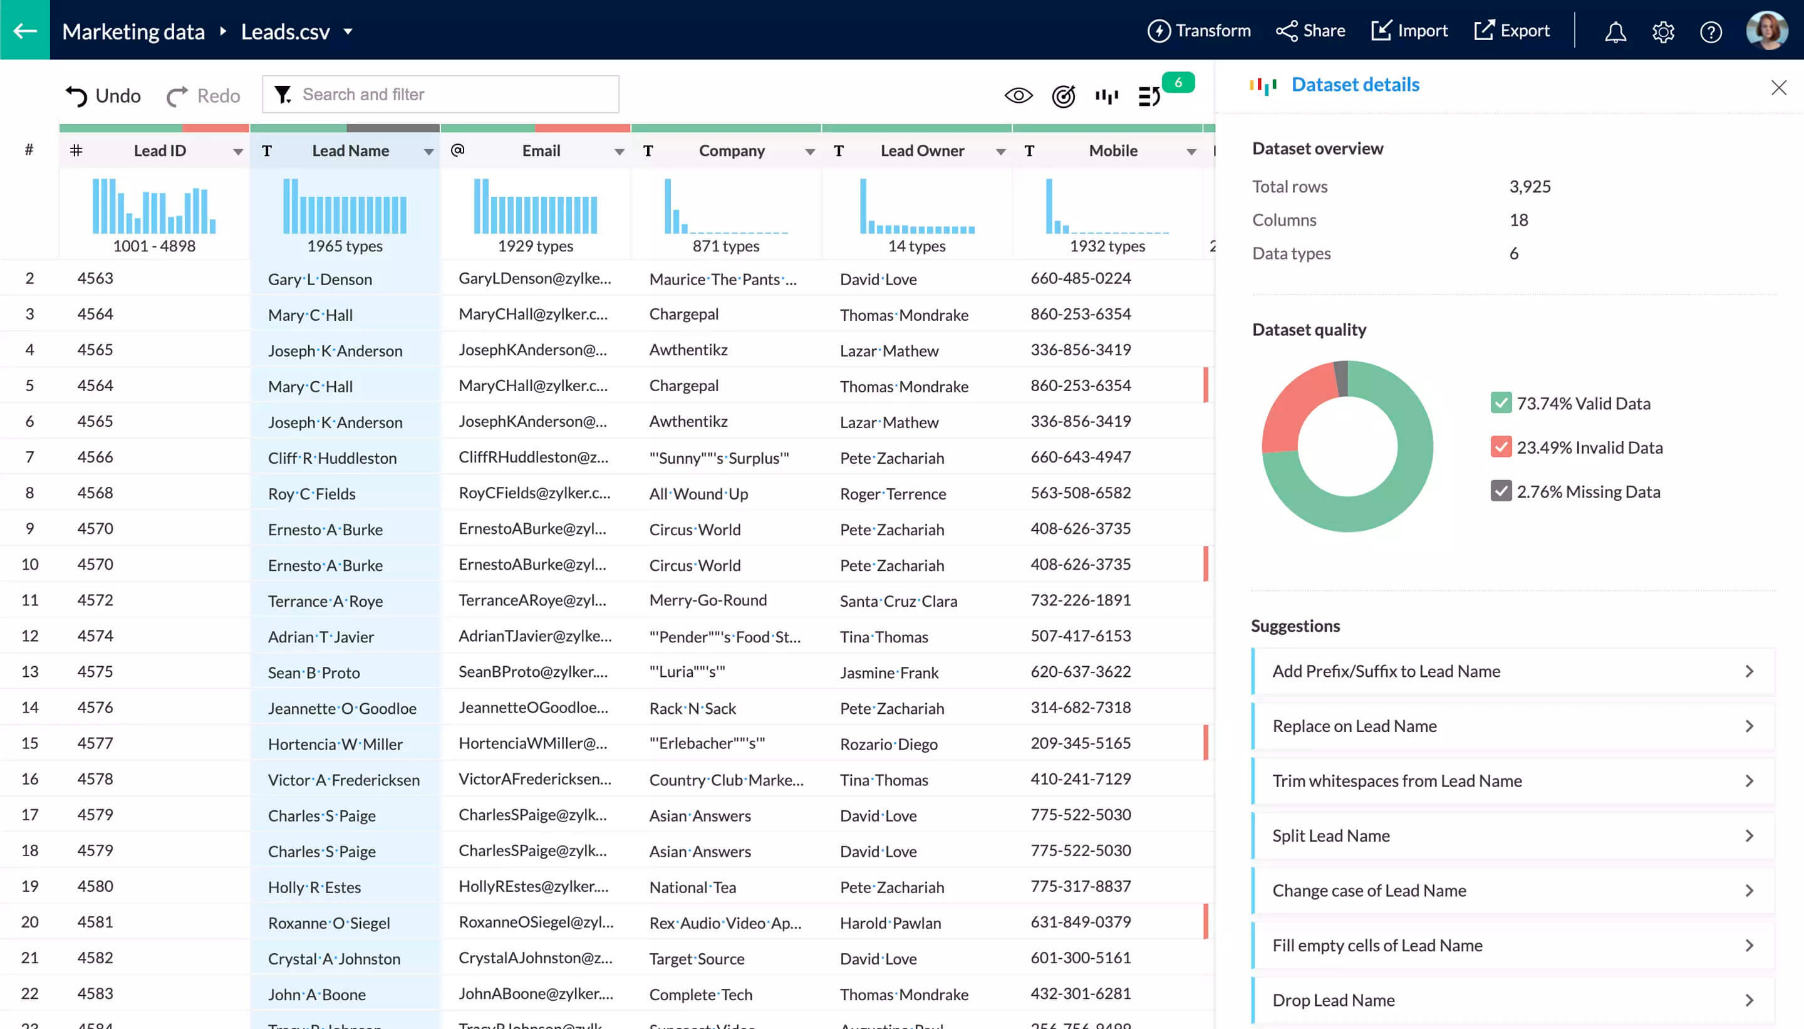
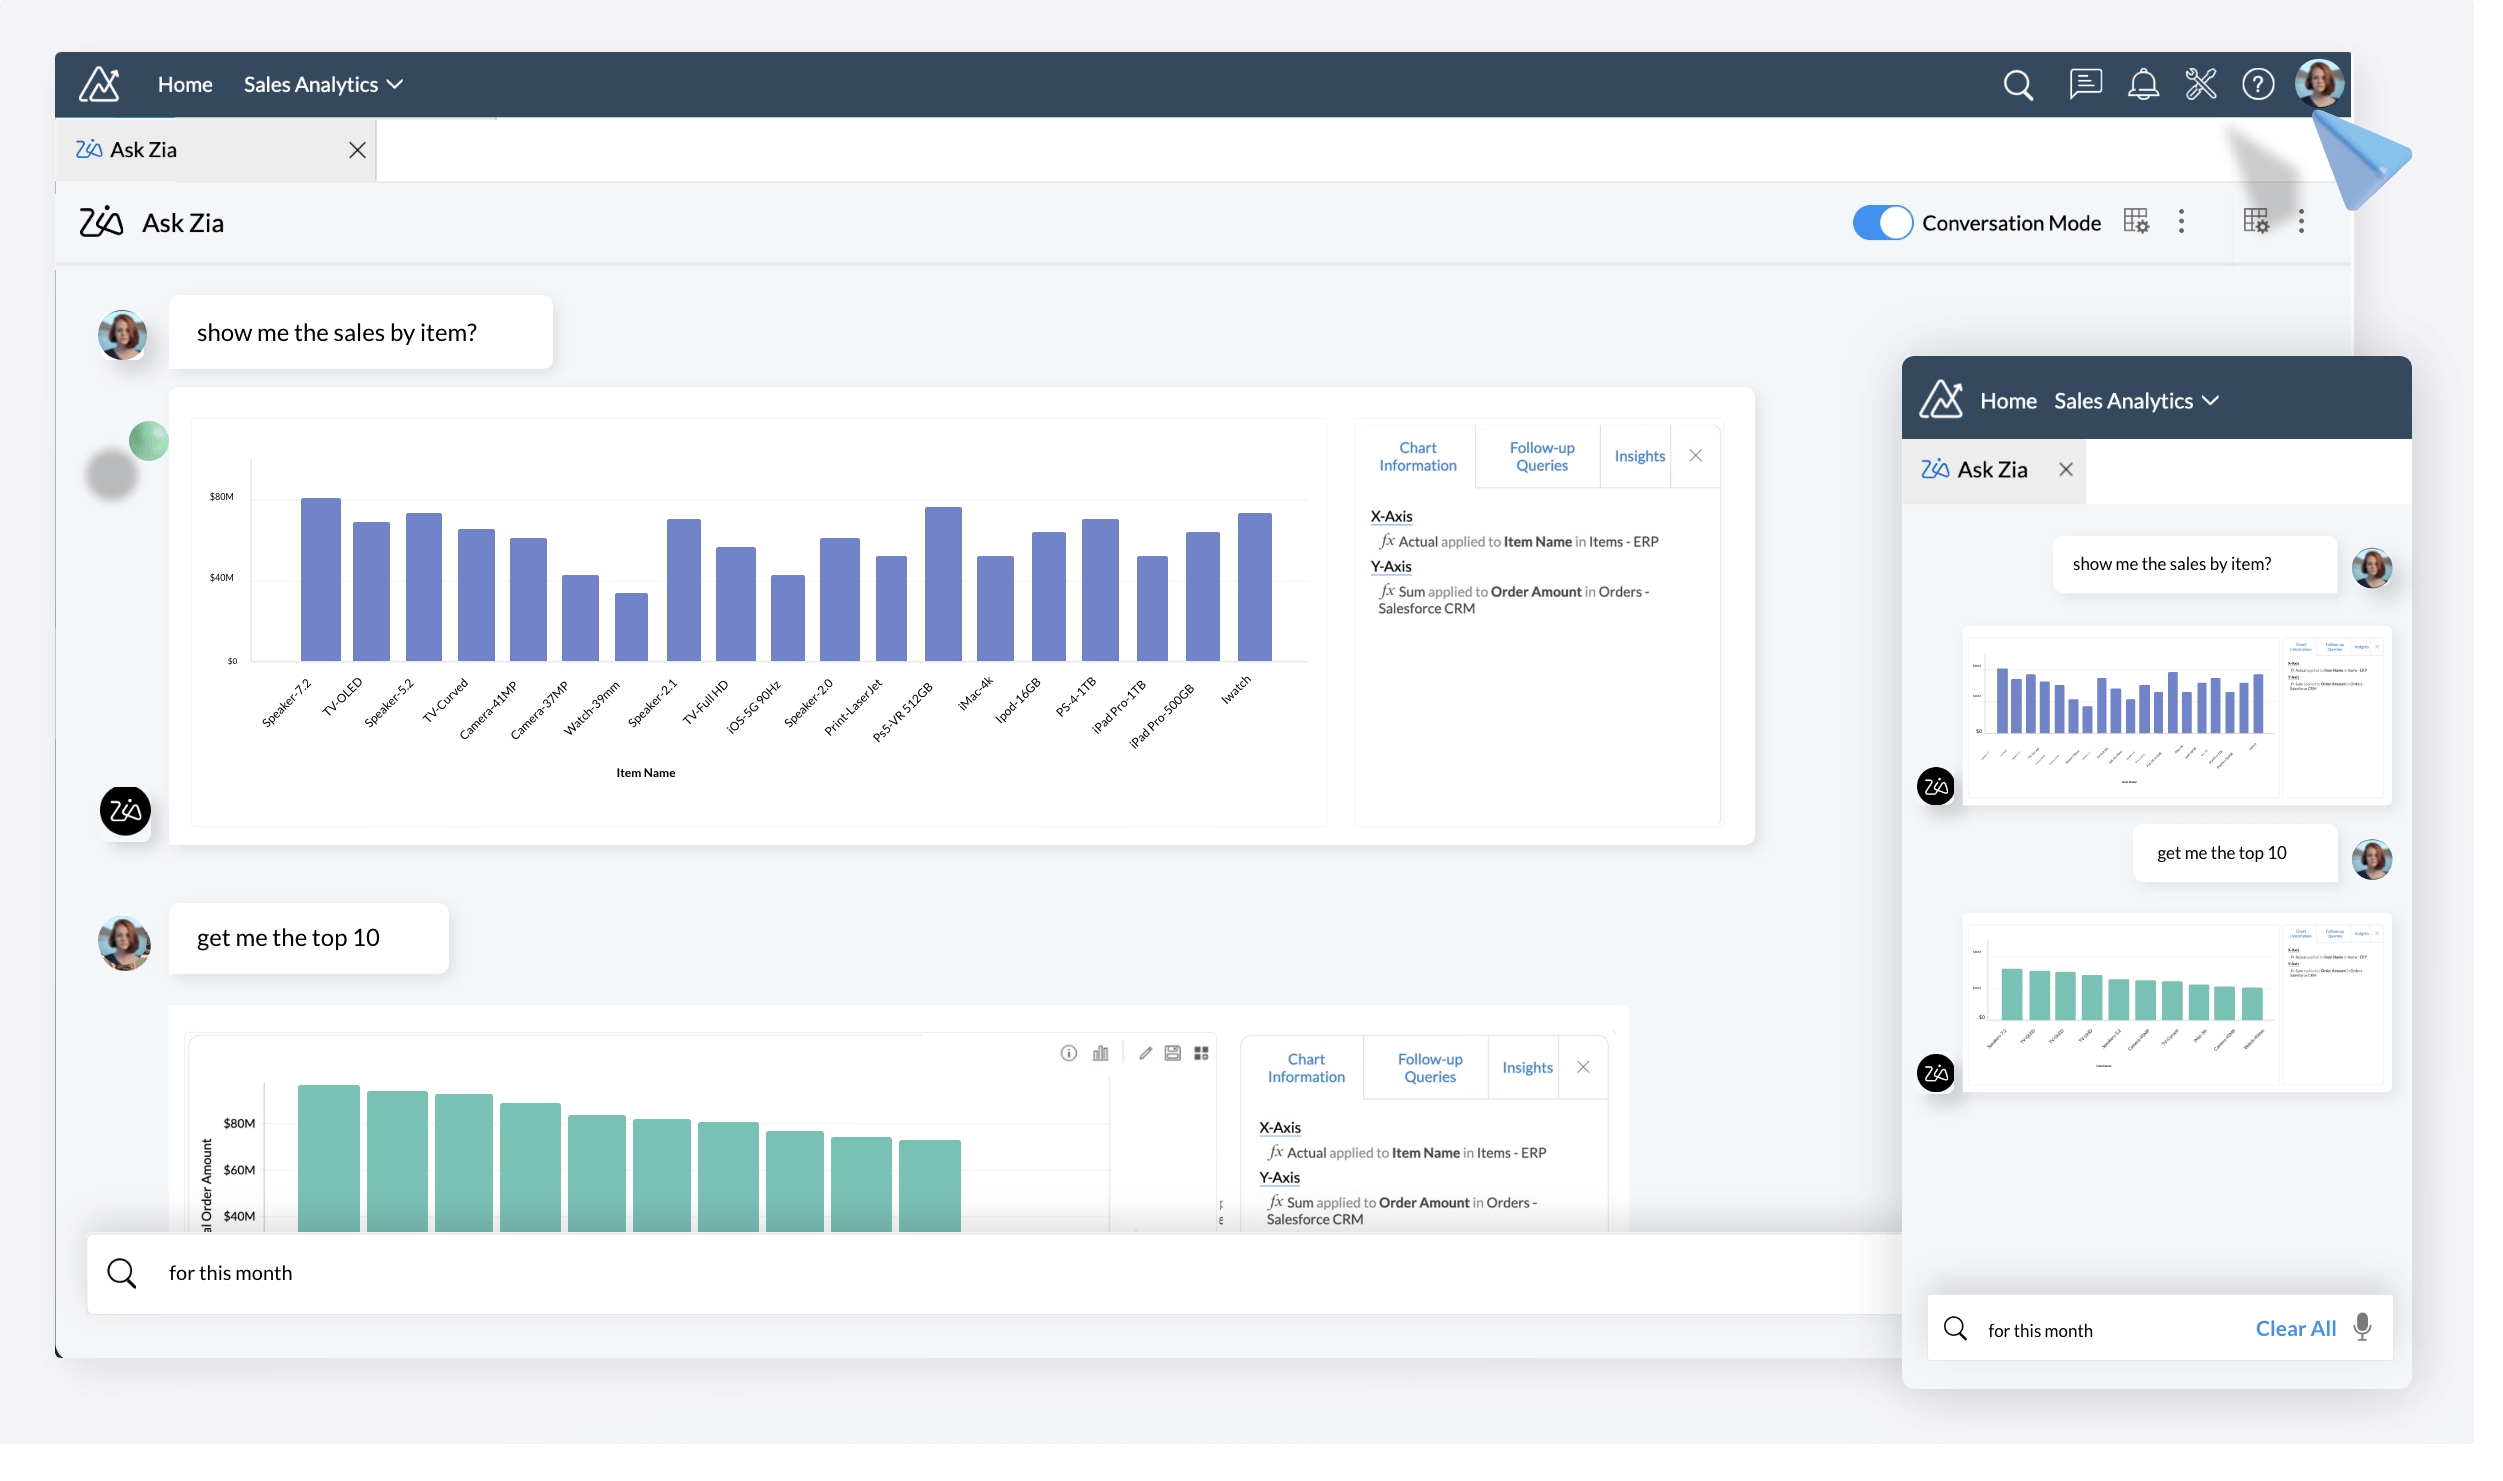
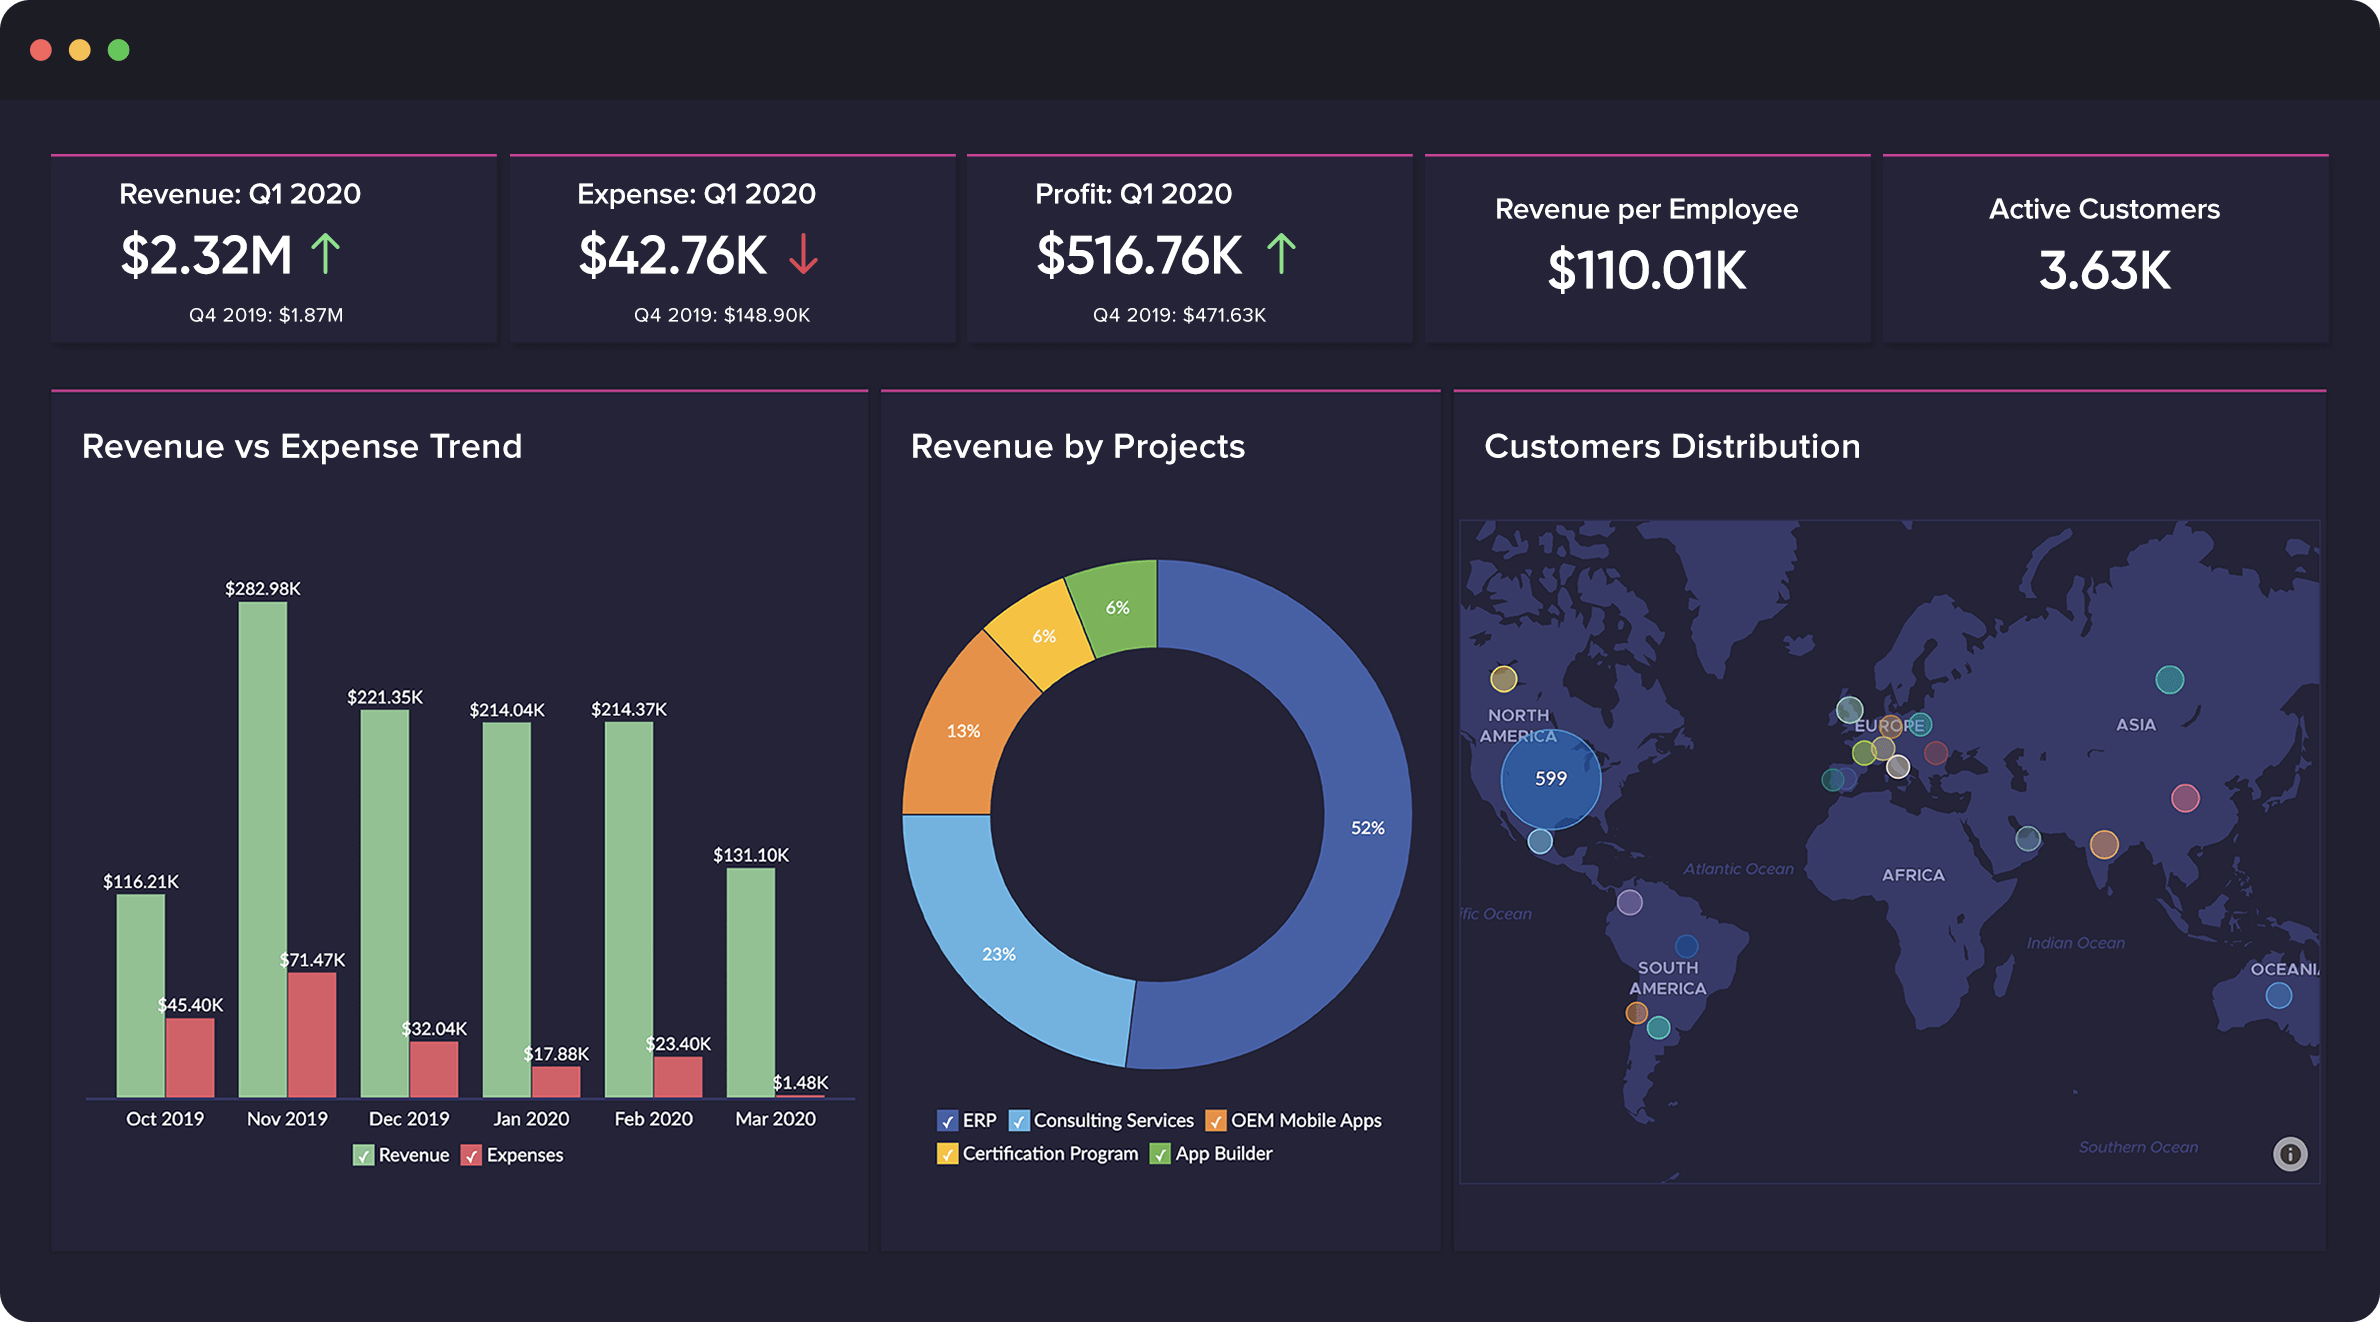
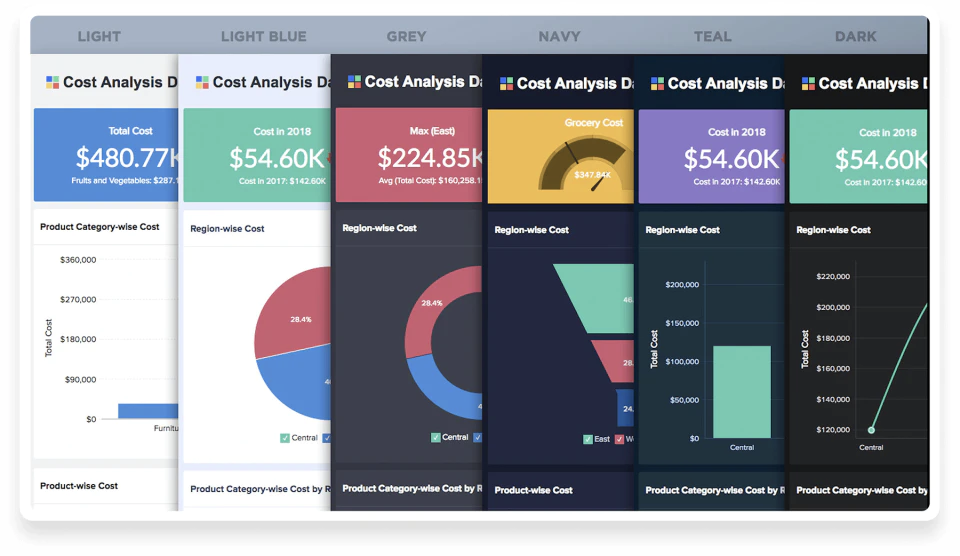

ZOHO Analytics help understand the business more effectively and efficiently, and the way data is presented helps in boosting productivity of business as well as the employees.
There can be more options for flowcharts and graphs, but nonetheless, the available options shall be available with more customisation features as per the user usage.
It helps the business to identify the key contributing areas/products of the catalog. It also helps in highlighting the slow-moving utilities held by the organinsation.
It is a great platform that is easy to use, Can merge reports in a single dashboard which is easy to share and anyone can pick it up and integrate with any applications such as Salesforce or Google sheets.
It takes time to run some reports, Rest everything is up to the mark.
It helps to analyze business data and create reports which are easy to share. Multiple reports can be created and merged on a single dashboard with a lot of amazing features such as graphical representation.
we can find the main platform connectors on the market for data extraction
the need for knowledge in sql to join data sources is a little laborious, in other tools I was able to join data in a simpler way
sql was a big hurdle for me, the controls are little confusing initially.
Here, we can create the widgets easily. The comparison and analysis feature also plays a vital role in providing analytics. The data capturing and visualization by images is convenient and easy compared to other alternatives. Apart from that, we can create datasheets, charts, reports, pivot tables, etc. the syncing of data is good and connects with the CRM. The UI is mind-blowing, and UX is also fantastic.
The first-time setup of this tool by any beginner is quite hectic. It takes a lot of time and permission for its initial use. Also, the formula configuration tool works not according to the needs and is sometimes misconfigured. Apart from that, everything is pretty well.
Our operations team and internal IT team are well connected with this tool to capture data quickly. Here, we can collect data from various sources rapidly and create the dashboard in just a few clicks. Also, it provides customized reports and other functionalities as per the user's demand. Overall, the performance is above expectation, and it performs very well.
It has multiple features, a good ability to merge reports in a single dashboard, easy report sharing.
It has a greater learning curve compared to other software, otherwise I did not see any.
It helped in customizing the views and what reports I like to see on my dashboards which helped me to easily and effectively predict results that were required for my project.
I really like the flexibility of Analytics to be able to create custom queries.
Analytics falls short when scheduling data exports, unable to schedule hourly. The SQL interface lacks refinement.
Analytics has solved data access issues to our backend legacy systems through queries, exports, and automation. We no longer have to guestimate how we are doing; we have the facts.
Zoho provides an excellent daily snapshot into our most important metrics.
The effort in setup requires some time and energy. However, once you have the system running, it performs well.
Our current CRM doesn't provide clear analytics on all of the metrics we like to track in our sales team. Zoho allows us to pull the data we want from our CRM to provide insights into demo rates, close rates, etc.
This reporting tool is very customizable and powerful. My company uses it as a data warehouse and it serves to connect different systems that otherwise don't talk to each other. You can create super user-friendly interfaces with it and embed them in other websites. I also like that you can drill down as much as you want (and customize the drill-down for client-facing applications) and create all kinds of different charts and tables.
It was pretty difficult to figure out how to use. I have a little bit of background in mySQL and creating reports but a lot of this was lost on me. Luckily I had other people to explain it and help me out, but it's not very user-friendly to those who don't already have some prerequisite knowledge.
It's extremely helpful to be able to take data from different sources, dump it all into Zoho, and then draw correlations. It helps us track performance, revenue, and more. The primary way I use it is through a survey view that has customized filters and colors. I can toggle the view and then export the data as an Excel file, PDF, etc.
The fact that ZOHO reports is user friendly makes my job easier. I can now have automated reports and can schedule emailing which comes in very handy. It provides powerful data visuals for dashboard presentations and these are easy to design. The sync between ZOHO Reports and ZOHO CRM helps the organization to do analytics on sales providing indicators on time and thereby helping in decision making. Business intelligent is now easier and the executive committee is now in a better position to produce meaningful strategies based on the results.
There are some elements which still need to be developed in order to come up with a better analysis. The threshold provides useful comparisons but I would also prefer if you worked on how one can add a trend line or a line of best fit on scatter plots. This will make it less rigid or confined to one measure.
Meaningful dashboards Scheduled emailing Automated Daily Stats reports and the link with ZOHO CRM is just amazing.
I like that I can tune into my work database from any location through the Zoho app!
The app speed seems to be pretty low but works fine on my laptop.
I am solving my issue of not being home when documents are uploaded that need to be looks at on a timely matter. Now I can access it from my mobile device.
Ease of creating reports. Everything is very Simple.
Sometimes not everyone I talk to sounds like an expert. I sometimes have to speak to multiple people to get my question answered.
We are easily tracking important information.
I like how well this tool implements with Zoho Projects. We use this tool to provide reports to leadership and review team goals. One small but important feature that I like is that I can show dates by ISO week. The charts and visualizations are useful for providing management. The price is at a good pricepoint for the level of utility we need.
So far, I have not had many issues with Zoho reports. I'm using it heavily as a task/project reporting tool along with Zoho Projects so I am not able to provide too much insight into other uses.
Project Planning and Project Reporting. It is beneficial for us to be able to give leadership members these reports instead of having them go through the individual projects. By connecting tasks to users, it also help our team see who is doing what and who is behind on what so we can allocate additional resources to a task.
I like that it can pull data for my reports across multiple modules. I like that it can export my 100,000+ equipment inventory unlike the regular reports module in CRM.
I dislike the limit of 5 pulls a day. I also dislike that's it's a big difficult (meaning I need to know a little bit of coding) in order to add different sections to my reports.
Easier access to my information makes work more productive and efficient for me
Ease of importing data, simplicity of updating data, ability to modify reports on the fly.
lack of customization features to reporting, lack of variability in report types.
Automation of reporting to save labor, putting information at the finger tips of program managers.
I like that it is easy to separate the data you are looking for and need to report on.
The once a day update/refresh is a little hard to get use to.
Monitoring Account Progress Tracking Sales Leads Allows us to look into the data further.
Zoho Reports is cheap and powerful. You can create custom reports by importing data from a local database either manually or through using their built in scripts to automate it.
The interface takes a little while to get used to. Automating data upload using the given script takes a fair amount of time to setup, and there's very little feedback to its success. It lacks a lot of the features of other more expensive tools (SAP Lumira, Tableau), but if you're not looking for something too advanced, this will work for you.
We've successfully used this to complement our other reporting tools (which were more tabular based) by using ZR's very graphic oriented reports. They look very professional and can be branded with your own customer logos.
Very easy to set up customized reports. I have some requirements that Zoho CRM can't do on it's own. I have Reports setup to pull data from CRM every night and send me a summary of all my projects on the go. I have one client that I have set up to receive the same summary of the projects they have on the go. If they have nothing going, system doesn't sent them summary.
Haven't found anything that I don't like.
See above. Saves me a ton of time as I only have to setup once.
I really enjoy being able to ad and remove uses as needed on the fly.
I think the interface is a bit bland but super responsive. I believe it could also be integrated better with the CRM and given better accessibility.
I use it to get more detailed information on the sales teams in my company and try to figure out what is working and what is not.
Zoho reports lets you create reports pretty simply and it lets you join multiple data sources together in a single report. The various filters are very helpful and relatively easy to use as well.
You need to be technically inclined to use the tool well. Understanding what data comes from where and how they relate to give you an accurate report is necessary, so this tool is not great for a novice or non-technical user.
We were pulling data from various reporting sources and trying to bring them together in a central place where everyone could view them. We succeeded in increasing visibility as we had hoped.
The interface is easy to use, I feel I can manage all aspects of my finances for my business using its different tabs, I can create invoices. Send receipts, keep track of costs
Sometimes the interface can be a little complicated. There are a lot of tabs in different mechanisms and sometimes I get a little confused with what exactly I'm looking at. But the analytics are still really important and I think I just need to keep practising using that the system
The software helps me analyze my profit margins, how well, I'm doing in the quarter, who owes me money, which invoices are paid and patterns in sales of my services


